
Most portable phased array systems available on the market calculate TFM from an elementary Full Matrix Capture (FMC), a data acquisition process where each element in an array is successively used as the transmitter, while all elements are used as receivers for each transmitted pulse. As all the elements are fired, scanning speed may be an issue given the large amount of data to be processed.
Eddyfi Technologies has implemented a new data acquisition technique for TFM called Plane Wave Imaging (PWI) in Capture™ 3.1 software. Acquisition consists of firing all elements of the array simultaneously along several angles, similar to a sectorial scan, while all the elements individually receive. A TFM is then performed providing improved productivity while keeping the optimum spatial resolution that is associated with TFM. PWI is a technique already covered by the Standards revisions.
This blog explains how to define a proper scan plan to ensure full coverage of a weld under inspection. The analysis of these results will be shared in another blog (subscribe here to receive blogs by email). To illustrate this, we inspected a 25-millimeter (1-inch) V weld with a 30-millimeter (1.2-inch) weld cap. We used a 64-element, 0.6-millimeter pitch probe at 5 MHz with a SW55 wedge. The material velocity, element check, and wedge delay calibrations were all performed. Codes state that a scan plan with a standard and repeatable methodology for examination should be provided. The scan plan shall include a depiction of the required examination volume coverage, imaging paths, image grid density, weld joint geometry, number of examination scan lines, and search unit placement and movement with respect to the weld axis. For welds thicker than 8 millimeters (0.3 inches), the Region Of Interest (ROI) of the TFM area should include the weld and at least 10 millimeters (0.4 inches) on each side of the weld of the parent material. Assuming that a manual scanner is used, we can expect some probe displacements along the index axis; the ROI should also include these potential displacements.
These criteria should be used to define all parameters in the following figure.
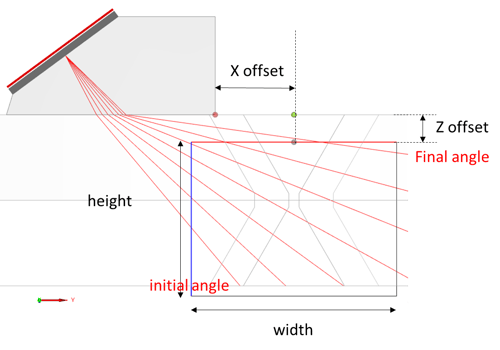
1. Index offset
The index offset is typically set to avoid getting in the way of the weld cap. With a weld cap of 30 millimeters (1.2 inches), we need a minimum index offset of 15 millimeters (0.6 inches). Welds typically have a finishing pass, so we add a pass width of 3 millimeters (0.1 inches) to the index offset. Finally, as we are using a manual scanner, we add ± 5 millimeters (0.2 inches) to include potential displacement of the scanner along the index axis. At the end, the index offset is 15 + 3 + 5 = 23 millimeters (0.9 inches).
2. TFM X offset
The center of the ROI is set along the weld axis at a distance equivalent to the index offset, i.e., 23 millimeters (0.9 inches).
3. TFM width
The width of the TFM should include the weld, so 30 millimeters (1.2 inches) here. According to standards, 10 millimeters (0.4 inches) on each side of the weld should be added. Finally, the potential displacements of the scanner should also be included, so another 5 millimeters (0.2 inches) here. Therefore, the width of the ROI is 30 + 2 x 10 + 2 x 5 = 60 millimeters (2.4 inches).
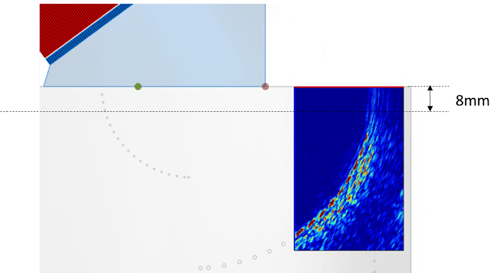
4. TFM Z offset
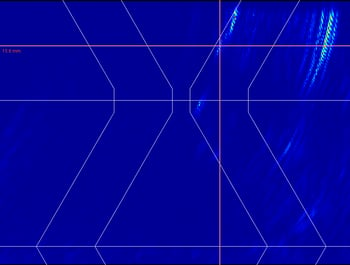
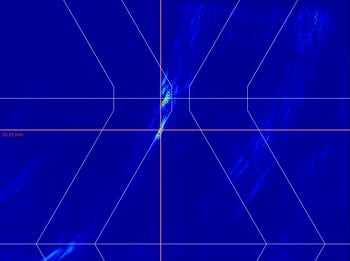
TFM, like phased array or conventional UT, cannot steer the energy for high angles; the amplitude is quite weak, and the beam is unfocused. The following figure shows the results of the PWI/TFM for the same configuration on an ASTM2391 mock-up. It is pretty clear that it is not possible to see the top side-drilled hole (SDH). Because we need to optimize the number of pixels to maximize productivity, it is not necessary to start the TFM area right along the top surface. For this reason, we set a Z offset of 8 millimeters (0.4 inches).
5. TFM height
Being conventional UT, PAUT or TFM, welds are inspected with the first and second legs. The first leg is used for the detection of indications close to the root, such as lack of penetration or root cracks, while the second leg is used for weld bevel, weld cap, and volume inspection. The TFM height should cover two times the weld height, 2 x 25 millimeters (1 inch), plus extra height for the weld cap, 3 millimeters (0.1 inches). As we start the ROI at 8 millimeters (0.3 inches), we choose a ROI height of (2 x 25 – 8 + 3) = 45 millimeters (1.8 inches).
The top part of the ROI represents the direct mode T-T and the bottom part, i.e., the second leg, represents the indirect mode TT-TT.
6. Choice of initial and final angles
PWI excitation is a sectorial scan with few angles; it generates plane waves with a width approximately as large as the aperture used (in the near field). We need to ensure proper insonification of the entire volume of the ROI. Ray tracing is used to check the coverage. We set the initial angle at the left edge of the weld on the second leg (40°) and the final angle close to the top right corner (85°). Obviously, the minimum angle should not be below 33 degrees when using shear waves. As we are using a large aperture (64 elements), the insonification covers the entire weld. The following video shows the beam for each angle and the superimposition of all beams.
7. Number of angles
The number of angles is a balance between productivity and sensitivity. If we use a large number of angles, the sensitivity increases significantly as we are sending more energy into the part. However, productivity decreases proportionally with the number of angles. The choice depends on the attenuation of the material and a trial-and-error approach. We found that one step every 7 degrees is a good compromise in this particular case.
8. Number of pixels: Amplitude Fidelity
The number of pixels must respect the Amplitude Fidelity criterion. It determines whether the TFM image is properly discretized to preserve the peak amplitude information. ASME V states that amplitude fidelity shall be preserved to 2dB or less, and that the process applied to check this fidelity be included in the qualified procedure.
Using the theoretical value, Capture software recommends using 218 kpixels. As we try to improve productivity, it is important to minimize the number of pixels as much as possible. Eddyfi Technologies has implemented an experimental approach that follows the guidelines provided in standards ISO_DIS_23865_(E). This approach takes the real configuration into account, thus all parameters such as material properties (attenuation), wedge definition, position of the grid relative to them, sampling frequency of the FMC, and the range.
According to the ISO standard, Amplitude Fidelity should be carried out in the middle of the ROI and 2 millimeters (0.1 inches) from the left and right edges. The following video shows this process; we verify that we pass the 2 dB criterion for the three positions.
Using this tool, we see that we can decrease the number of pixels and still pass the 2 dB criterion imposed by standards. We decrease the number of pixels starting from the theoretical value until the amplitude fidelity no longer passes. We then set the number of pixels above that value. Using this strategy we are able to decrease the number of pixels from 208 kpixel to 121 kpixels, improving the scan speed from 57 millimeters (2.2 inches) per second to 94 millimeters (3.7 inches) per second for a data point at every millimeter (0.04 inch).
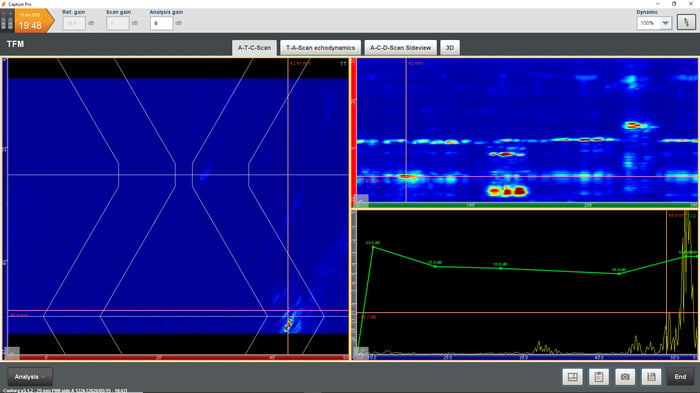
9. Sensitivity correction or Time Corrected Gain (TCG)
Like conventional UT and phased array, TFM provides a color-coded image; therefore, it is necessary for the display to provide a uniform color code related to the amplitude at all sound path distances. We thus perform a Time Corrected Gain across our entire ROI. This process is explained in this blog and follows the guidance of the ISO standard. Essentially, the probe is moved over side-drilled holes and the amplitude on each SDH is recorded for every horizontal line in the ROI, over its complete width. Then, a gain is applied for every horizontal line and the depth of each SDH to obtain 80% screen height.
Application
After setting up the scan plan, we performed an acquisition on each side of the weld acquiring data points at every millimeter (0.04 inch). The weld contains three defects: a toe crack, lack of side wall fusion, and a root crack (from left to right in the C-scan images). In the following images, we report a T-scan image for each defect from both sides.
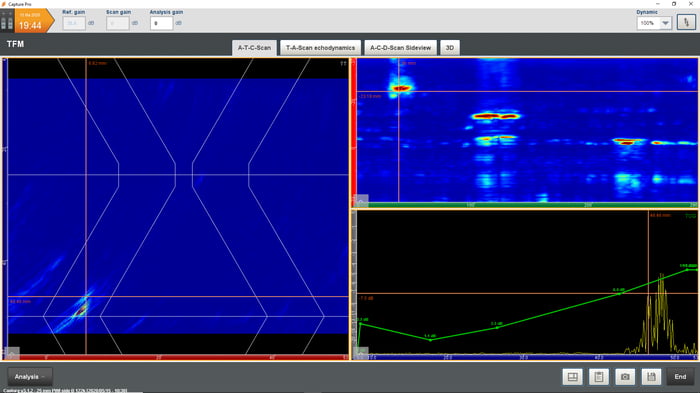
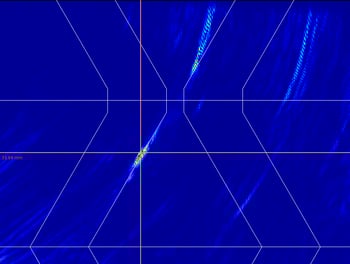
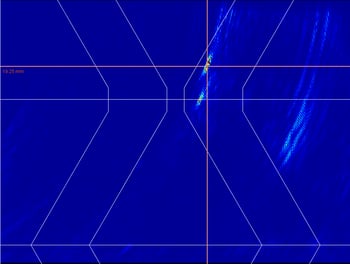
Side 2
We can see on the C-scans that the three defects are visible from both sides of the weld. The analysis of these scans will be the subject of another blog, so make sure to subscribe for updates.
Plane Wave Imaging is available with the M2M Gekko® using Capture 3.1 and higher version software as well as with Acquire™, the data acquisition software for the M2M Panther™. Both tools are designed to tackle in-service and manufacturing inspections, each with their own requirements in terms of productivity and sensitivity.
Stay ahead of the competition with our Beyond Current solutions, the Gekko and Panther for PWI/TFM inspections. Contact us for more information today.