
Total Focusing Method (TFM) technique was introduced to ASME codes in 2019. It is used by many customers today for various applications such as weld inspection, High Temperature Hydrogen Attack (HTHA) and Hydrogen Induced Cracking (HIC). For these applications, operators expect a level of productivity and sensitivity that is compatible with their inspection requirements in terms of asset availability and defect sizes. Thus, it is important to provide a technique that meets these requirements.
TFM is a reconstruction technique that focuses the ultrasonic energy in every pixel of a region of interest (ROI). It provides optimum spatial resolution and improved sensitivity for the detection of small indications. TFM is very similar to optical microscopes or telescopes: the greater the diameter of the lens or its aperture, the greater the resolution. TFM works on the same principle where the spatial resolution of the method increases with a larger aperture, i.e., more elements.
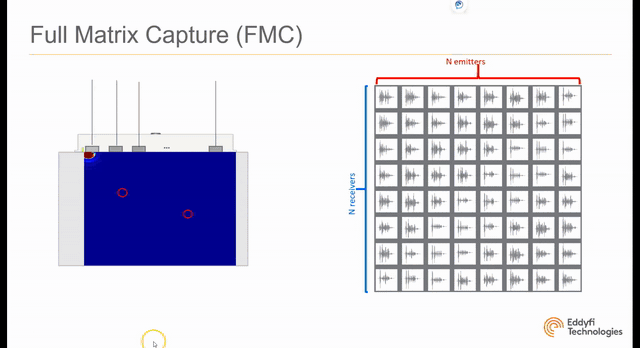
Most portable phased-array systems available on the market calculate TFM from an elementary Full Matrix Capture (FMC), a data acquisition process for which each element in an array (N elements) is successively used as the transmitter, while all elements are used as receivers for each transmitted pulse. The result of the FMC acquisition process is generally presented in a table-like pattern N x N with two axes, where one axis signifies the transmit pattern and the other signifies the receive pattern. The FMC process is explained in the following video.
Scanning speed is often listed as an FMC/TFM drawback as systems need to fire all the elements individually to record the entire FMC. The system architecture has a great impact on productivity. Most systems with a 32:128 architecture can only record the acoustic information on 32 channels, simultaneously forcing them to fire all the elements twice to record a full 64-element TFM. This leads to a drop in the scanning speed by a factor of 2, making inspections difficult in the field. For this reason the M2M Gekko® —since its inception— has offered an architecture that allows data recording on 64 elements simultaneously, providing optimum scanning speed for a given array configuration. Thanks to its experience with TFM, Eddyfi Technologies has provided several speed improvements through software upgrades to make it the fastest TFM on a portable phased array ultrasonic testing (PAUT) system.
One way to improve scanning speed is by reducing the number of excitations. Reducing the number of array elements isn’t ideal as it would reduce the overall aperture and thus the effectiveness of the TFM method. Eddyfi Technologies has implemented a new data acquisition technique for TFM, called Plane Wave Imaging (PWI). This technique comes from the medical world where it has been thoroughly tested.
The acquisition consists of firing all the elements of the array simultaneously along several angles, like a sectorial scan, while all the elements receive individually. A TFM is then performed the same way as before, providing improved productivity while keeping the optimum spatial resolution that we know with TFM.
The following video explains the principle of PWI.
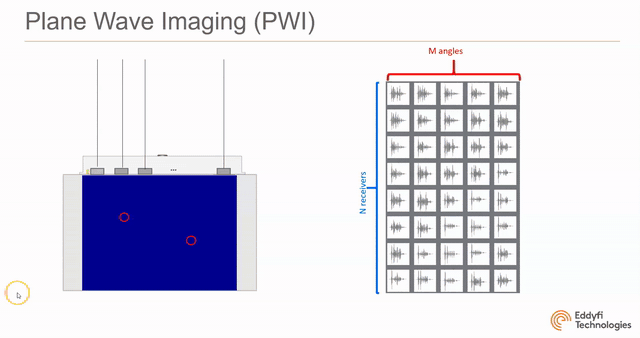
At the end of the PWI data acquisition process, the resulting matrix contains M × N elementary A-scans compared to N x N for FMC, where M is the number of angles and N is the number of elements. Of course, the idea here is to have M angles as small as possible to improve productivity while maintaining an image with sufficient resolution and sensitivity.
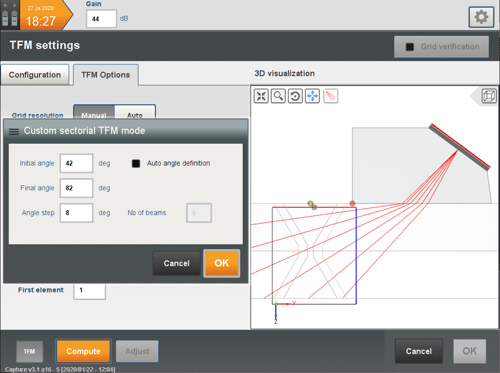
The following image shows how PWI is configurated on the Gekko. In this example, we look at a 25 mm (1 in) V weld. We used a 64L5-G3 probe with a SW55 wedge. We set six angles between 42 and 82 degrees to cover the weld directly and on the second leg inspection. The TFM area, calculated for the TT mode, was also sized and positioned to completely cover the weld and the Heat Affected Zone (HAZ). It leads to a TFM area of 44 x 51 mm (1.7 x 2 in). The number of pixels is determined using the Amplitude Fidelity wizard, explained here, to respect a drop in amplitude of less than 2 dB.
One can see that PWI looks very similar to a sectorial scan for PAUT. The user defines the minimum, maximum angles and the angle step. The low angles are used to inspect the bevel and volume of the weld after a rebound off the backwall while the high angles are used to inspect the root of the weld. People familiar with PAUT inspection can use PWI right away, and there is no need to worry about where to focus the energy as TFM will focus everywhere in the region of interest.
To evaluate the performance of PWI, we compared it to FMC/TFM for the inspection of the weld mentioned before. We used the same TFM size with the same number of pixels for both cases. For PWI, the number of angles is limited to six, which is a significant drop from the 64 excitations required for the FMC/TFM acquisition, and of course we used the full 64 elements of the array for both cases. All calibration steps were performed for both techniques following standards:
- Element check and sensitivity compensation
- Wedge delay calibration
- TFM/PWI calculation
- Amplitude fidelity
- Time-Corrected Gain (TCG)
Acquiring data points every 1 mm (0.04 in) with an encoder leads to a scanning speed of 135 mm (5.31 in) per second for PWI, which is a significant improvement over a normal FMC/TFM of 16 mm (0.63 in) per second. The Gekko is equipped with a fast FMC/TFM mode that can further improve the speed up to 55 mm (2.17 in) per second in this configuration. We can see the big improvement in productivity provided by PWI:
- Normal FMC/TFM: 16 mm/s
- Fast FMC/TFM: 55 mm/s
- PWI/TFM: 135 mm/s
At this point, it is worth noting that a 32:128 system that doesn’t record data on the full 64 elements simultaneously would see a speed of 8 mm (0.21 in) per second for the same configuration.
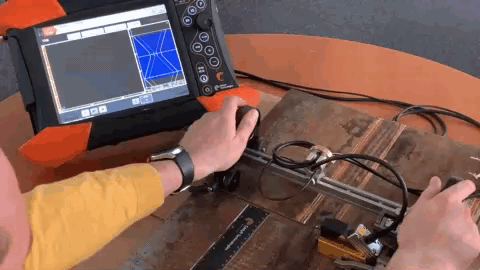
The following video shows the acquisition using PWI.
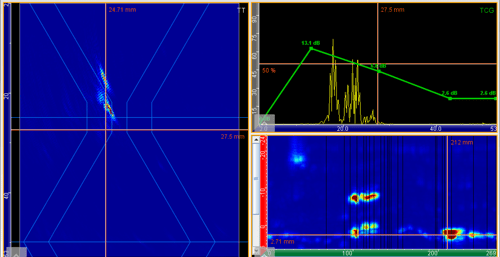
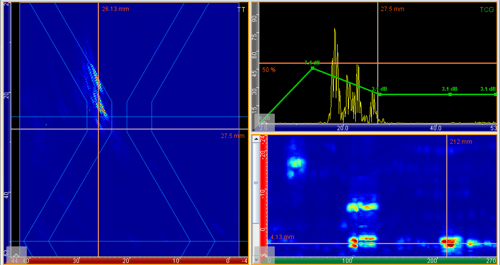
We compared the quality of the images obtained with both TFM techniques. The top image shows the results obtained with the FMC/TFM and the bottom one with the PWI/TFM. We can see that the results are identical: all three defects (root crack, toe crack and crack along the fusion face) are detected. Missing frames on the C-scan of the FMC/TFM data are a result of the difficultly in moving the probe at a steady 16 mm (0.63 in) per second.
PWI offers the same spatial resolution as TFM with a big improvement in productivity.
Another advantage of PWI is the potential increase in sensitivity. When performing FMC/TFM, we fire each element individually. While the reconstruction process uses the full 64 elements, the excitation of only one element may not be enough while inspecting thick structures and/or noisy materials. In the case of PWI, we fire all the elements at the same time sending more energy into the part. The overall energy level, thus sensitivity, depends on the number of angles used during the PWI/TFM process.
Here we compare FMC//TFM to PWI/TFM for an HTHA inspection. We used a sample that contains microcracks along the inner diameter (ID) surface; a micrography of that surface is shown in the following figures. The micrograph was taken along the backwall of the sample. The setups used for comparison is summarized in the following table together with the TFM images obtained for the FMC (top) and PWI (bottom), respectively. We used a 64L10-G2 probe (pitch 0.3 mm/0.01 in) with a TFM that contains 92 kpixels.
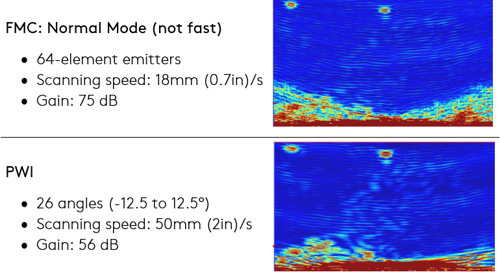
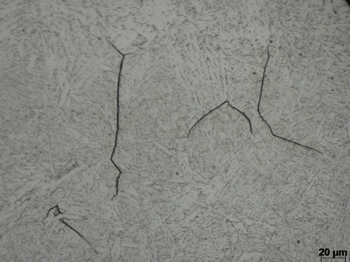
Again, we can see that TFM images obtained from FMC and PWI data acquisition are similar except for the gain used for PWI which is about 20 dB less, providing better Signal-to-Noise Ratio (SNR). The strong signal along the backwall (bottom left corner in the PWI image) is due to the HTHA visible in the micrography. For that particular position, FMC/TFM leads to some diffraction patterns that cover the indications making it difficult to see the HTHA. We can also start to see micro-cracking propagating inside the thickness of the material in the PWI image. The improved sensitivity allows the detection of smaller indications. Productivity is also improved for that configuration as we used about 2-3 times fewer excitations.
PWI provides the same spatial resolution as FMC/TFM with an improvement in productivity and sensitivity. The operator can adjust the number of angles to choose the best compromise between scanning speed and SNR for more flexibility in his inspections.
There is another benefit of using PWI: the potential to save the elementary A-scans that constitute the matrix used for TFM reconstruction. Some systems propose recording the FMC data and calculating the TFM with post-processing. Recording the elementary A-scans offer the advantage of being able to recalculate the TFM with any mode, resizing and moving the region of interest of the TFM. However, this process suffers from several problems:
- Recording the complete elementary data significantly slows the inspection as dozens of MB need to transit to the system’s hard drive through various ports.
- Systems that cannot display the TFM in real-time cannot provide an indication on the quality of the data recorded. Inspectors may have to record data again after calculating the TFM on an external PC.
- Another disadvantage is the quantity of data saved. For example, the inspection of the V weld mentioned before on a 508 mm (20 in) pipe with data points every 1 mm (0.04 in) would result in data files close to 50 GB, which is not realistic in the field.
By reducing the number of excitations, PWI drastically reduces the amount of data if one wishes to record the M x N elementary signals. For the 508 mm (20 in) pipe and the six angles mentioned before, the amount of data would decrease by a factor of 10. While still big, it becomes more manageable. Data can be post-processed with CIVA Analysis; we also provide a free library for customers using their own software.
PWI is available with the Gekko operating with Capture™ 3.1 and above, and with the data acquisition software of M2M Panther™, Acquire™. Both solutions tackle in-service and manufacturing inspections - both with their requirements for productivity and sensitivity. The new PWI technique is readily available on the Panther and just recently made accessible on the Gekko, providing the means to reach optimal productivity and sensitivity inspection requirements.
Ready to raise the bar in your TFM inspections and stay Beyond Current? Contact us now discover Eddyfi Technologies solutions for better and faster assessments today!